This visualization exercise is based on a data chart posted by Dr. Jonathan Foley on Bluesky. Dr. Foley is the Executive Director of Project Drawdown, a solution-focused NGO doing outreach and problem-solving on climate change.
The donut chart is exactly what I’ve been trying to locate for some time: a single source of truth on climate change sources.
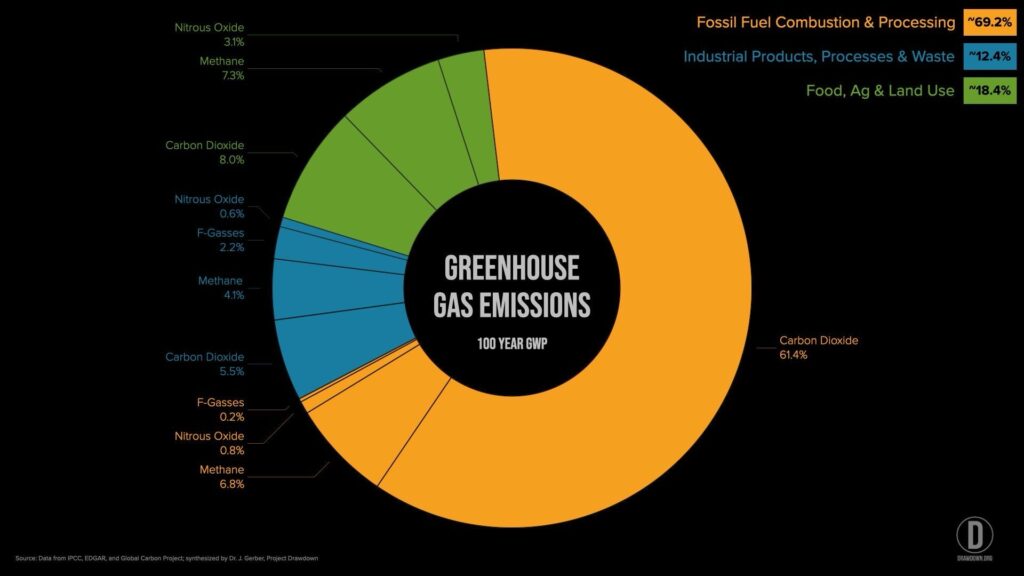
I’ve been a devotee of climate studies since I heard the term “global warming” last century. One big problem: the innumerable references and unverified claims that abound make it difficult for the average person to get to the source of truth. That truth, and how it is distributed, is critical for easily consumed, evidence-based information untarnished by the noise of special interests, social media, and biased news sources.
The donut chart was an excellent start but, as a designer, I wanted to do more to to make it easier for the average person to understand.
My goals
- Simple and readable (as much as that can be done with complex scientific matters)
- Capture all the data in a single snapshot
- Use eye-catching color, type and layout
- Create it with code for either an online digital, shareable version or screen capture it to share on social media
- Make it responsive to accommodate any screen size
- Meet accessibility standards for contrast and readability
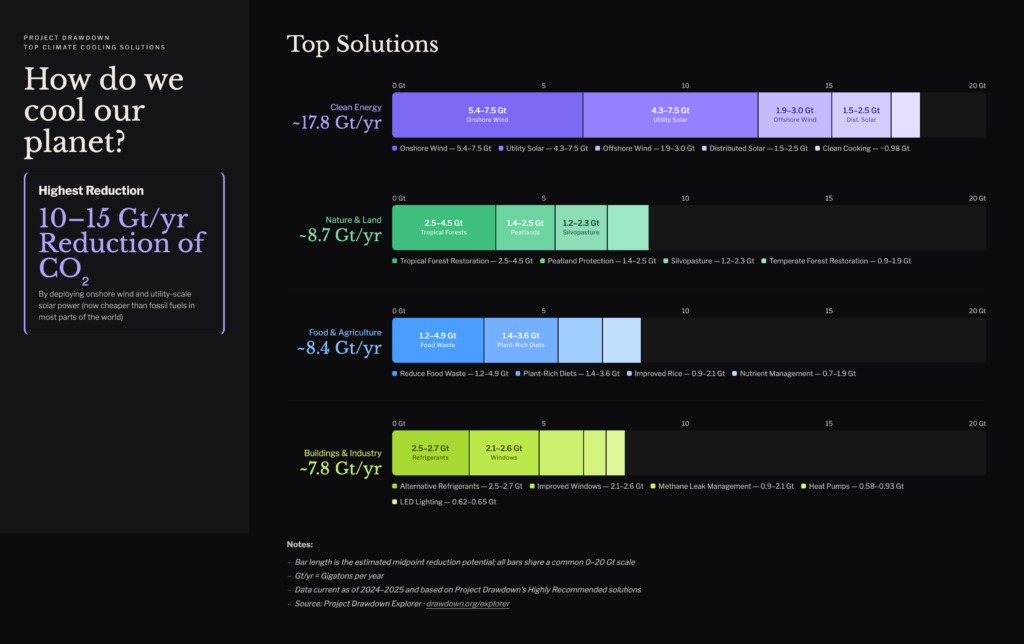
- Add a new solution-based visualization to pair with the emissions source data
The results
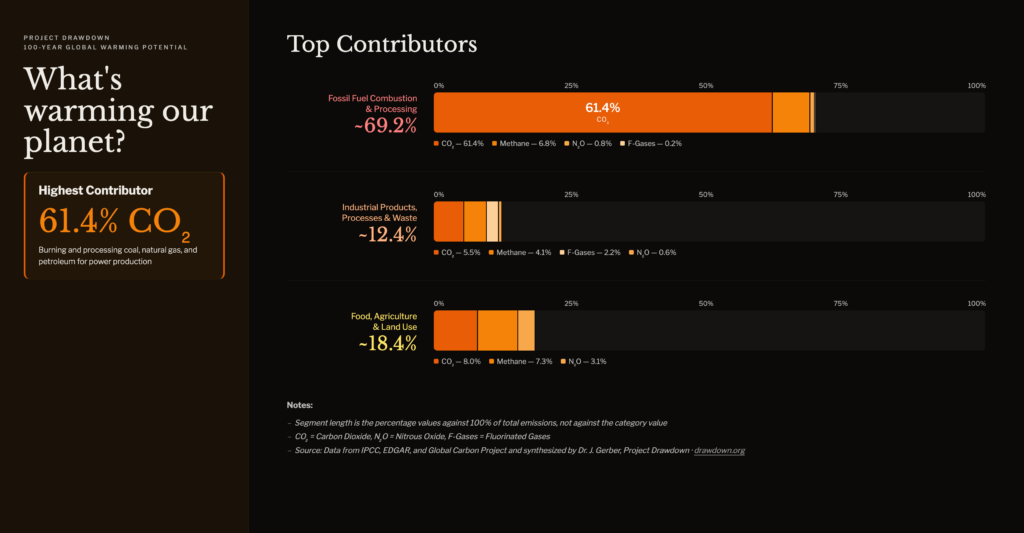
Desktop/widescreen version
Climate emissions
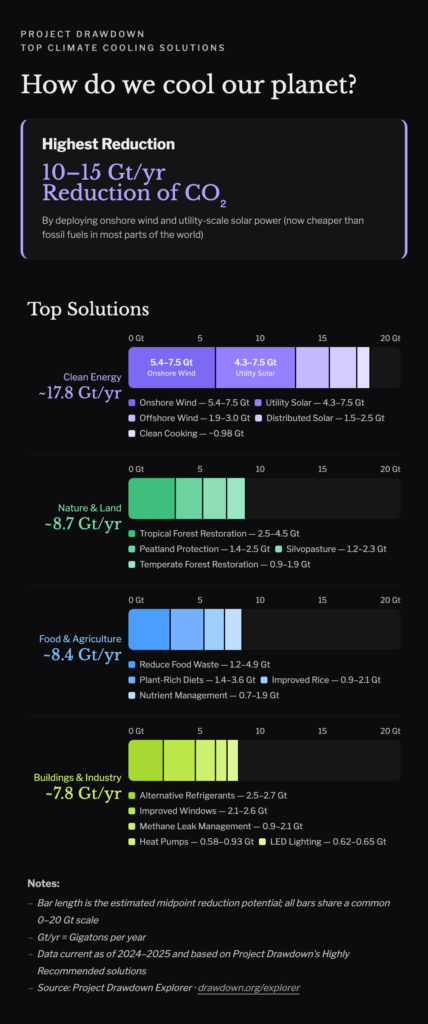
Climate solutions
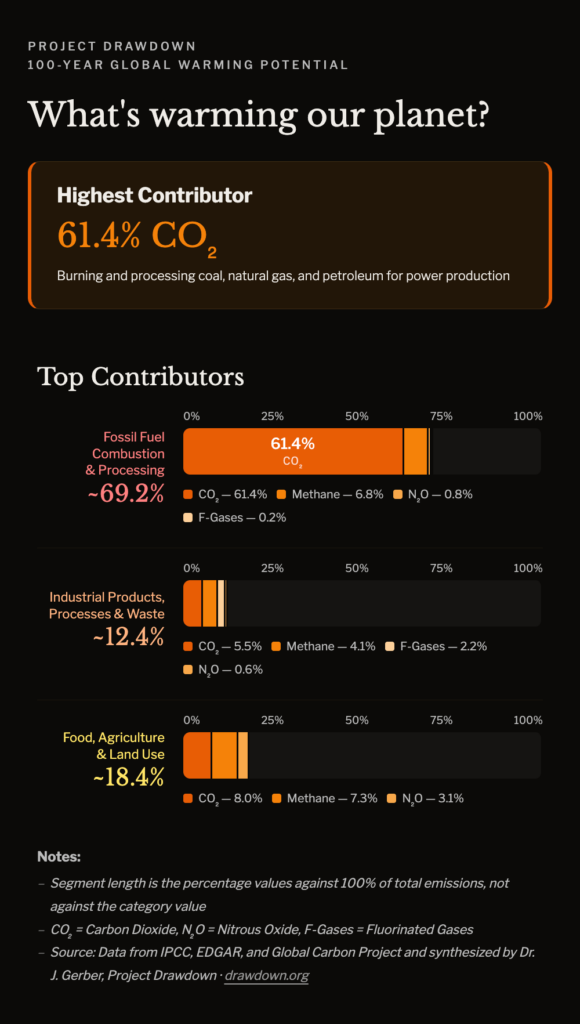
Mobile version
Climate emissions
Climate solutions
Try the digital, responsive versions
How I did it
- I used Claude AI as my Associate and Analyst to bounce ideas off of
- I came up with some simple visualization ideas and Claude helped me narrow down the choices
- I plugged in original chart and we brainstormed several approaches
- I finally landed on this stacked bar approach to achieve my first couple of goals
- Claude did a fabulous job coding the design with Python (saving me many hours of potential work), especially with responsive layouts, but there were a lot of the revisions that I did by my own hand. Most of that extra work took me a good part of the week working a couple hours a day (AI is so helpful but not the end all of problem-solving)
- The solutions infographic was tricky to get an honest representation of ranged data so I chose the midpoints. It’s also difficult because the data doesn’t map to the emissions infographic in percentages or gigatons which is a challenge in the data formats.
What you’re seeing
- A single screen of evidence-based data that can be visually consumed quickly
- I used warm and cold color schemes to represent the problem and solution, respectively
- The mobile version of both infographics as seen on an iPhone 12 – scales down to iPhone 5 screen size
- A desktop version of both infographics
- Hierarchical presentation with:
- Hero section highlighting the number one problem/solution for instant impact
- Stacked horizontal bar graphs of all data for quick visual consumption. Supplementary notes to reduced confusion
- Minimal science-y language, and language in general, knowing most people will overlook text
- Accessible color and type that meets WCAG Standards
All data is from Project Drawdown. The solutions are on a governmental scale (municipal, regional, national) not on a personal scale, which might be one more visualization to add.
Data sources:
- Climate warming infographic source: IPCC, EDGAR, and Global Carbon Project and synthesized by Dr. J. Gerber. Original infographic
- Climate cooling infographic source: https://drawdown.org/explorer. I used the top Highly Recommended solutions from the explorer.
Tools used
Claude AI was the main tool I used to remix the data into the stacked bar method. Claude employed Python to render the methodology. I used Figma to create some mockups to test accessibility, responsiveness, and styles. I used the Zed code editor for taking Claude’s outputs and my mockups for revising and generating the new infographics.
Whether you found this compelling, provocative, or even mildly interesting, please support Project Drawdown!